EBI Portfolio Rebalance – November 2022

If you hold your investments with Clearwater via the Transact or Standard Life Platforms and your portfolios are managed by Evidence Based Investments (EBI), you may have been wondering about some recent transactions on your account. These transactions, initiated by EBI, are as a result of a periodic rebalance; there are no charges associated with the rebalance.

You may recall that previous rebalances were carried out on an annual or ad hoc basis and your permission would have been sought, as part of this process. With the new Vantage Portfolios EBI have the discretion to conduct such rebalances without prior reference to the clients and that is what has happened on this occasion. In addition, EBI now conduct rebalances only when individual funds breach certain thresholds, this maximises efficiency and reduces unnecessary trading.

The following has been taken from the recent communication from EBI to us, explaining the rationale for the rebalance:

“EBI monitors the drift of all assets within the model portfolios and as of today, the Emerging Markets element of our Earth Portfolio range has drifted away from its initial target to breach the set tolerance limit. It is therefore important we carry out a rebalance to bring the portfolios closer towards their target asset allocation and ensure the risk profile is maintained.” 

Rebalancing is not carried out to obtain any performance advantage, although this can happen, it is to ensure that portfolios remain within the agreed risk parameters.

As a number of clients have queried these unexpected transactions, Adam and I have decided to notify everyone in advance next time.

I do hope the above makes sense but, as always, if you have any concerns about your own financial arrangements or would like to discuss whether you are truly making the most of your money, please do not hesitate to call me.

With kind regards,

Yours sincerely

Graham Ponting CFP Chartered FCSI

Managing Partner


Inflation

As we all wait with bated breath for the Chancellor’s statement tomorrow, I am indebted to 7IM for the following:

“We all know that “Beauty is in the eye of the beholder”. But that idea applies just as much to economics as it does to art. Take the hottest topic around – inflation.

A survey by the Bank of Japan last month found that 86% of the population had seen unfavourable price rises”, with 46% of them saying the prices were SIGNFICANTLY higher than a year ago.

Sounds serious.

Until you realise that annual inflation in Japan is 3%.

It’s tempting to ask what all the fuss is about. After all, we’re at 10% inflation here in the UK (11.1% as of this morning)! But remember the “eye of the beholder.” It’s about what’s “normal.” Inflation has averaged 1% for forty years in Japan. So even a tiny increase feels brutal.

Compare that to somewhere like Sri Lanka, where inflation is a savage 66%. But actually, in Sri Lanka, surveys aren’t anywhere near as negative as in Japan. That’s because average inflation over 40 years has been 11% (and often above 20%). A different baseline for comparison – resulting in different behaviour.

Source: IMF WEO/7IM

Thinking about different inflation experiences around the world is a helpful reminder that what you’re used to defines what you expect.

And the follow-up to that is that what you expect dictates your reaction to what happens.”

I really enjoy considering how psychology influences financial decisions and stats like this are a reminder that whilst we think we all see the world in the same way, our interpretation is entirely dictated by how we frame it.

That’s why numbers are never the whole story when it comes to investing – it’s about the people behind the numbers as well.

I am delighted to report that none of my clients panic when confronted by volatility as part of a long-term investment strategy, and I like to think this is because I have conditioned them to expect it! None of us like it when it happens BUT, we know how to react when it does, and that is to wait for it to pass.  

I do hope the above makes sense but, as always, if you have any concerns about your own financial arrangements or would like to discuss whether you are truly making the most of your money, please do not hesitate to call me.

With kind regards,

Yours sincerely

Graham Ponting CFP Chartered FCSI

Managing Partner


The Optimist’s View

It is hardly surprising in recent times that there has been considerable volatility in the bond and equity markets; turn on the television, listen to a politician or open a newspaper, and there is a good chance you’ll see someone prophesying imminent economic doom.

Such claims serve to depress stocks (and bonds) in the short term, but they do also provide opportunities in the long term, the expected future return of the market is always greater after such falls, no matter how counter-intuitive that might seem.

Optimism

Kevin Kelly, the founding editor of Wired magazine, wrote in his essay The Case for Optimism that: “The psychological temperament of an optimist is not a sunny disposition or a Pollyanna delusion that everything is ideal. Rather, optimists believe that bad things are produced by temporary causes that can be overcome, while pessimists believe bad things always happen, and if anything good happens, it’s temporary.”

Optimism is always essential in long-term investment but especially in periods of drawdown (market falls). It gives us the chance to discern signals from noise and identify the gap between perception and reality.

Looking ahead

Entrepreneurialism and societal progress require a great deal of optimism because it reminds us of what is possible, and it helps us to imagine what the future might look like.

In 1889, Charles H. Duell was the Commissioner of US patent office. He is widely quoted as having stated that the patent office would soon shrink in size, and eventually close, because……..wait for it -

“Everything that can be invented has been invented.”*

Charles H. Duell*, 1899

How could anybody be so short-sighted, particularly after the motor car had only been patented by Carl Benz in 1886? Just think of all the inventions, innovations and advancements that were made after 1899 and throughout the 20th Century – the aeroplane, computers, space rockets, the mobile telephone, and the internet for example. With the advent of each of the above examples (and of course many others) entrepreneurs took risks, they sought investors, they employed many staff who then earned wages (on which they paid tax) and spent them in the economy, helping to perpetuate the virtuous circle we know as capitalism. It’s not a perfect system capable of leading to great inequality in the distribution of wealth, but it’s the best system we currently have and almost all advancements in living standards can be attributed to it. I am putting the creation of a welfare state to one side in this piece but that too must not be overlooked when reflecting on how we live today.

Charles H. Duell’s problem was that he wasn’t an optimist! The optimist in me says that capitalism, for all its faults, is likely to continue to drive invention and innovation and prosperity will follow.    

Most of us would agree that there is still much to be invented and discovered. We tend to think these new ‘inventions’ will be more extraordinary and advanced than those which preceded them, but that might not necessarily be entirely true. An invention or innovation need not be revolutionary, or even unique, to be significant, many ‘new’ inventions are derivative of their predecessors.

From door locks to light bulbs, shovels to toilets, and the classic mouse-trap, innovation comes in many forms and from many directions, often right under our noses. Sliced bread? Bottled water?

Nothing is so basic, or so great, that it cannot be made better

Levi Strauss & Company studied their evolving customer along with their 501 iconic denim blue jean, created in 1873. Levi’s noted that the most requested alteration for tailors “around the world” were for hemming and tapering the leg of the classic 501. Thus, this year, Levi’s re-invented the classic blue jean with built-in “customization and tapering:” the new Levi’s 501ct.

First there were leaves, then hand towels, and then cloth rolls one would pull and reuse. (disgusting when you think about it…) Next was the ‘folded paper towel dispenser’ and in recent years the ‘hot air dryer’ replaced the towel dispenser.

And, now, Dyson has replaced the air dryer with their ‘Airblade.’ Anyone who thought no more money could be made from people washing their hands in public lavatories was very much mistaken! Sometimes the innovations that drive up living standards and create great wealth for their creators and their investors (that’s us by the way) are just simple improvements on what has gone before.

Take the following example:

According to Wikipedia, “Belts have been documented as an item of male clothing since the Bronze Age.” — Roughly, 2500 B.C.

And yet, Randa Accessories, which is the world’s largest men’s accessories company, selling over 40 million belts each year, opened its ‘Belt Lab’ in 2015 with the goal of doubling the size of the entire belt market.

Recent innovations include the reinvention of the holes in belts — now reinforced with ‘industrial-strength’ materials sandwiched between layers of leather, an improved ‘patent-pending’ reversible belt buckle technology (black to brown, leather to fabric, dress to casual), a new leather ‘stretch’ belt feature, new point-of-sale fixtures, new size, and colour replenishment modelling, and more.

To most of us, a belt is just a belt, a commodity, but to Randa it’s not; it’s much more than that, it’s a lifestyle accessory that can be refined adjusted and improved, seemingly endlessly, for greater profit!

Necessity can be the mother of invention, and/or innovation and it can be found in every facet of our lives.

In summary, we don’t need something as fundamental as a new internet to be invented every year for the stock market to go up and for investors to have a successful long-term investment experience, something Charles H. Duell would have done well to figure out.

I do hope the above makes sense but, as always, if you have any concerns about your own financial arrangements or would like to discuss whether you are truly making the most of your money, please do not hesitate to call me.

With kind regards,

Yours sincerely

Graham Ponting CFP Chartered FCSI

Managing Partner


* There is no documentary evidence he actually said this but I really hope he did!

Does a Simple Equity/Bond Asset Allocation Still work?

When sitting in my office, I often try to imagine what questions my clients might like to ask me if they were sat with me and that is often how I come up with the material for these regular communications. This week I have been pondering whether clients might understandably be asking the question posed in the title?

Over the past few weeks, I have written that low risk investments have been falling at the same pace, if not faster than high risk investments and that being the case, it seems reasonable to question whether a portfolio containing equities (to provide long-term growth) and bonds (to smooth out volatility) is still a sensible mix.  

The following article written by Giulio Renzi-Ricci, head of portfolio construction at Vanguard, Europe, answers this question:

“It has been a difficult year for equity and bond markets.

With inflation at record highs, sharp reversals in monetary policy and a perfect storm of events driving down prices, it is understandable that investors want to be sure their investment strategy is appropriate for the times.

Indeed, it is particularly in times of volatility that advisers can help investors consider the bigger picture and retain focus on their long-term goals. We believe the evidence is clear that a well-established approach to asset allocation – in which a balanced, risk-adjusted portfolio of equities and bonds is held for the long term at a low cost – continues to serve investors well.

Share-bond diversification in historical context

Some investors have been unnerved by equities and bond prices declining in lock step over the course of the year. In fact, brief, simultaneous declines in shares and bonds are not unusual, as our chart shows.

Viewed monthly since early 1995, in GBP terms, the nominal total returns of both global shares and investment-grade bonds have been negative around 13 per cent of the time. That is a month of joint declines a little over every seven months or so, on average.

Historically, once the market has had time to adjust, the negative correlation between bonds and equities has re-established itself within a matter of months. Our analysis of recent prolonged market downturns suggests the longer a crisis drags on, the more likely bonds are to play a stabilising role.

Bonds as ballast

This is particularly important, as the primary role of bonds in an investment portfolio is not to drive returns but to act as a stabiliser. We are cautious of proposed alternatives to investment grade bonds as the main counterweight to equities in a balanced portfolio.

Asset classes such as real estate (property) introduce cost and liquidity concerns. Sectors such as commodities and high-yield debt can help with hedging unexpected inflation but exhibit equity-like behaviours.

Hedging strategies such as put options introduce complexity, while still being exposed to considerable drawdowns. This is not to say there is not an investment case for these approaches in particular circumstances. Rather, there is not a compelling substitute to the benefits high-quality fixed income provides with regard to diversification, transparency, relative simplicity and cost.

Equally, it is unlikely that long-term investors will be able to preserve returns simply by coming out of the market. Short-term market timing is extremely difficult even for professional investors and, we believe, doomed to fail as a portfolio strategy.

Markets are incredibly efficient at quickly pricing unexpected news and shocks, such as the invasion of Ukraine or the accelerated and synchronised central bank response to global inflation. Chasing performance and reacting to headlines tend not to work in the long term since it often amounts to buying high and selling low.

What might the future hold?

It is also important to remember that, with the painful market adjustments year-to-date, the return outlook for the 60/40 portfolio has improved.

Driven by lower share valuations and higher interest rates, our forecast for the 10-year annualised average return outlook for the 60/40 portfolio is to 6.7 per cent. That is more than three percentage points higher than at the start of the year.

Over the next 30 years, we predict the average return of a 60/40 portfolio to be around 6.9 per cent in GBP terms. The inherent volatility of markets means these returns will always be uneven, comprising periods of higher or lower – and, yes, even negative –returns.

No magic in 60/40, just balance and discipline

The broader, more important issue is the effectiveness of a diversified portfolio, balanced across different asset classes, in keeping with an investor’s risk tolerance and time horizon. In that sense, 60/40 is shorthand for an investor’s strategic asset allocation, whatever their actual target mix.

We do not believe in one-size-fits-all solutions in this regard. Investors can dial up or down the risk-return profile of their portfolios depending on their investment goals, investment horizon, risk tolerance and a set of realistic expectations for asset returns (net of costs).

The last thing investors should be doing, however, is to abandon the principles of good asset allocation.”

I do hope the above makes sense but, as always, if you have any concerns about your own financial arrangements or would like to discuss whether you are truly making the most of your money, please do not hesitate to call me.

With kind regards,

Yours sincerely

Graham Ponting CFP Chartered FCSI

Managing Partner


The Mini-Budget and some Context!

When I last sent one of these communications on 22nd September, I ended with the following, “Things will improve when inflation appears to be coming under a degree of control and if/when there is some kind of resolution in Ukraine; I do hope to be able to write with more positive news soon.” This was of course, before Kwasi Kwarteng’s so-called ‘Mini-Budget’, which has spooked the currency market, the UK Gilt market and, to some extent the UK equity market. As a result, I do not have any good news to report just yet, but I do want to provide some context which I hope might settle some nerves.

I don’t want to get into the politics of announcing the removal of the 45p tax rate at a time of hardship for many (it’s not now happening of course) but it does seem that this is the aspect of ‘Mini-budget’ that the media and opposition parties have latched on to. The inference in the media has been that it was this announcement that caused the pound to crash and the Gilt market to go into freefall – it wasn’t! Out of a total package of tax cuts announced amounting to some £40 billion, the loss to the exchequer from repealing the 45p rate would have only been about £2 billion (5% of the total) and it could have led to higher tax receipts as the wealthy lose the incentive to find convoluted ways to avoid it. No, the markets (unlike the media) responded to the important bit, the other £38 billion of cuts and how they were to be funded - through borrowing! When Kwarteng publishes the Fiscal Plan, now at the end of October and not 23rd November (thankfully), the markets might settle down a little, until then the markets are staring into the dark, unsure of the impact on the financial stability of the UK, further volatility can therefore be expected.

So, where is the context that might settle clients’ nerves? Well, Clearwater portfolios (constructed and managed by EBI) are not just invested in the UK Gilt and Stock markets; the geographical spread (top 10 countries) of our most popular portfolio Vantage Earth 60, is currently as follows:

  1. United States (US) 50.68%

  2. United Kingdom (GB) 6.98%

  3. Japan (JP) 6.58%

  4. Germany (DE) 4.90%

  5. France (FR) 3.43%

  6. Canada (CA) 3.22%

  7. China (CN) 2.37%

  8. Switzerland (CH) 2.26%

  9. Australia (AU) 2.18%

  10. Italy (IT) 1.43%

The gyrations in the UK are certainly having an impact on the performance of our portfolios but it is what is happening in the wider world that is much more important, the global fight against inflation and the war in Ukraine.

If there is a silver lining to the clouds around us, it is actually in the weakness of the pound relative to the dollar because of the weighting we have in the US. The following chart shows how far the S&P 500 has fallen since the beginning of the year in Dollar terms:

As you can see, a fall of 23.76% since the start of the year! This second chart shows the same index but in Sterling terms:

We still see a substantial fall of -6.85% but the pounds weakness has provided a welcome hedge against the worst of the falls. It is important to understand that a significant strengthening of the pound would unwind this position but let’s hope that any such strengthening accompanies a recovery in the US stock market.

In terms of fixed interest exposure, only 11.36% is in the UK and only some of this is invested in UK Gilts which have been hit so hard by recent events. The following chart compares the performance of our Bonds vs the UK Gilt Market as a whole, since the beginning of the year:

What the charts above demonstrate is the benefit of diversification. Investments across multiple countries and multiple sectors ensures that we are never going to be at the bottom of the pile when shockwaves are felt, unfortunately it does not mean our portfolios can buck global trends. The battle against global inflation and the war in Ukraine will continue to cause substantial volatility in markets but this volatility comes hand-in-glove with long-term investing.

One last chart to provide more context – this one shows portfolio Vantage Earth 60 (simulated returns) over the past 20 years.

When we look back over many years we can see plenty of incidences of extreme volatility BUT we got through it in the end! While writing to one of my clients this week, I was reminded of Boris Johnsons’ tribute to the late Queen, he referred to her broadcast to the children of the nation during World War II, age 14, during which she offered these encouraging words; “We know, every one of us, that in the end all will be well.” I think that attitude of optimism is the best way to get through each day whilst markets are gyrating all over the place, we will come through it ……. eventually.   

I do hope the above makes sense but, as always, if you have any concerns about your own financial arrangements or would like to discuss whether you are truly making the most of your money, please do not hesitate to call me.

With kind regards,

Yours sincerely

Graham Ponting CFP Chartered FCSI

Managing Partner


Update

Yesterday, the Federal Reserve in the US increased interest rates by the widely expected 0.75%, but the markets still fell sharply following comments by chairman Jerome Powell that central banks still have “some way to go” in their fight against inflation. He indicated that rates have only just reached levels in the States where they are starting to have the necessary effect on prices. This hawkish stance is not helpful to equity or bond markets, meaning there is no hiding place from the pain just now.

I was interested that in the UK equity markets rose yesterday, even though on the Today programme on Radio 4 yesterday morning, I listened to Sergei Markov, a former adviser to Vladimir Putin, all but threaten the West with full scale nuclear war. I fully expected the markets to fall off a cliff at the open but of course they didn’t, as most see these statements as the empty threats they almost certainly are, let’s hope they are right.

It is clear that the equity and bond markets are focussed firmly on inflation and the actions that central banks are taking to tackle this, with even the prospect of nuclear war having very little effect.

Against this febrile backdrop I thought an update on how the Clearwater Portfolios, managed by EBI, have been doing might be welcome.

This first chart shows how EBI Vantage Bond, EBI Vantage 60 (60% equities, 40% bonds) and EBI Vantage 100 have performed since the start of the year. In this chart we can see how the portfolios containing equities rallied during the period June to August, but that the Bond portfolio continued its downward slide, due to the continuing increases in interest rates.   

This next chart focusses on the market rally from 16th June to 19th August. Here we can see that the 100% equity portfolio rose by over 14% in a period of just over 2 months, highlighting why it is so important to stay invested through periods of volatility – we never know when sentiment is likely to change, and markets tend to respond very quickly when it does.  

We must then look at what has happened since 19th August. The following chart shows a renewed slide caused almost exclusively by the hawkish stance being taken by central banks to combat inflation. Interest rate rises had previously been priced in to some degree but as inflation around the globe has proved so persistent, central bankers have turned up the heat even further and consequently, markets have given back most of the progress that was made earlier in the summer.

I am conscious that I quite often provide updates on how our portfolios are performing but what I don’t often go into is, how are our portfolios performing when compared to others? The following couple of charts address this.

These are slightly different charts which look at returns on the vertical access, with volatility (risk) on the horizontal access. If you think about it, the perfect portfolio would appear in the top left corner, because this would mean the portfolio had performed spectacularly well but with very little volatility – sadly, no such portfolio or fund exists.

This first chart looks at the same portfolios above and compares them with the appropriate sector averages over the year 31st August 2021 to 31st August 2022.

If we first look at point E towards the bottom left of the chart, this represents the EBI Vantage Earth Bond portfolio, and compare this with point F, which represents the pension sector average. Here we can see that the sector average has delivered a worse return and with greater volatility, this is a good result (relatively) for the EBI portfolio. The EBI portfolio has still fallen over the course of the year, but it hasn’t fallen as far, and it has been less volatile.
The same is true for the EBI Vantage Earth 60, against its peer group and also EBI Vantage Earth 100, against the global equity sector. In each example we can see better performance from EBI with lower volatility.   

The chart above just looks at the past 12 months, which I think we can all agree, has been unusual. The following chart, however, covers the 20-year period from 31st August 2002 (The EBI portfolios haven’t existed for 20 years, so these are simulated returns). Even over this much longer time period, the results are the same, except for the Bond portfolio. Over this longer period, the sector has marginally outperformed, BUT it has done so with considerably more volatility.  

I hope the above charts have helped provide some reassurance that, although things are not going particularly well at the moment, on average our investment solution is faring as well (if not slightly better) than alternative offerings.

Things will improve when inflation appears to be coming under a degree of control and if/when there is some kind of resolution in Ukraine; I do hope to be able to write with more positive news soon.  

I do hope the above makes sense but, as always, if you have any concerns about your own financial arrangements or would like to discuss whether you are truly making the most of your money, please do not hesitate to call me.

With kind regards,

Yours sincerely

Graham Ponting CFP Chartered FCSI

Managing Partner


The Energy Transition

The following is a piece I was reading this morning from LGT Wealth Management. I thought it was interesting and hope you do too.

“The global energy complex is under pressure. Supplies, already constrained due to Russian sanctions, have been further strangled by the impact of the summer heatwave. In France, which frequently relies on up to 70% of its energy from nuclear, the rivers essential to the cooling of the reactors are too warm, reducing current nuclear energy production by half. Germany’s Rhine River is currently too shallow to transport cargo, including traditional energy, and the Sichuan province of China which relies on hydropower for 82% of its power generation, is seeing its worst drought in more than half a century halving hydropower capacity and causing a number of factories to close. Even efficiency of solar energy is impacted by hot weather. For every degree above 25C, the efficiency of a solar panel can drop by as much as 0.5%. When a panel temperature reaches 45C, the solar efficiency could fall by 10%.

You could be mistaken for thinking that the soaring traditional energy prices are a source of distraction from investment in green energy, which ironically is made more inefficient by the summer heatwave. In fact, it is quite the opposite.

The US

Last month, the US passed a historic Inflation Reduction Act. Whilst many countries have recently approved climate packages and enforced regulation, the size and scope of this Act should not be underestimated. It represents more than $370billion of investment and subsidies to be spent over 10 years dedicated to climate and energy measures. These include tax credits for EVs, $20bn spent on clean vehicle manufacturing facilities, 10 years of consumer residential energy tax credits and $20billion to support climate-smart agricultural practices.

The EU

In response to the outbreak of war in Ukraine, the European Union published their plan to reduce reliance on Russian oil and gas. This represents spending of circa €300bn by 2030[1] and includes investing in solar and wind power, energy storage investment, green hydrogen innovation and promotes awarding of permits to renewable energy projects.

China

Whilst these significant commitments by some of the developed world’s largest economic powers seem encouraging, they pale into comparison to the levels of deployed climate investment since already this year by China. Last year, China accounted for 46% of the world’s new construction of renewable energy infrastructure, investing $380bn, more than any other country during 2021. China’s solar energy spending for the first six months of this year has totalled $42 billion (173% higher than last year). The country’s spending on new wind projects totalled $58 billion (107% above 2021 levels). According to China Renewable Energy Engineering Institute, the country is set to install a record 156 gigawatts of wind turbines and solar panels this year. By comparison under the Inflation Reduction Act, additions to US wind capacity could increase from 15 to 39 gigawatts per year in 2025-2026, according to researchers at Princeton University.

China leads global energy transition spending
Public and private investments, 2012-2021

Source: BloombergNEP, Note: The UK is included in EU calculations until 2020

The energy transition represents one of the most environmentally, but also economically, important shifts of recent times.”

Inevitably this transition will throw up exciting investment opportunities around the globe which our highly diversified portfolios (managed by EBI) are well positioned to take full advantage of.

I do hope the above makes sense but, as always, if you have any concerns about your own financial arrangements or would like to discuss whether you are truly making the most of your money, please do not hesitate to call me.

With kind regards,

Yours sincerely

Graham Ponting CFP Chartered FCSI

Managing Partner


1 G. Lengauer, F. Esser, R. Berganza, Negativity in political news: A review of concepts, operationalizations and key findings. Journalism 13, 179–202 (2012)

Do you want the Bad News or the Good News?

Some of what follows has been taken from a communication I received from 7IM Investment Management last week, I thought it was interesting and worth sharing.

Do you want the good news or the bad news? As it happens, you don’t really have a choice. Your brain is only interested in the bad news.

And unfortunately, the world is a scary place day-by-day. We are bombarded by negative news – studies estimate that just 10% of daily news stories are ‘good’1. And those studies don’t include what people are reading on Twitter and Facebook!

There’s a lot of messy psychological stuff at work here. Our brains are designed to engage more with negative news than positive news, so media outlets keep it coming, swamping our optimism with every click and swipe we make.

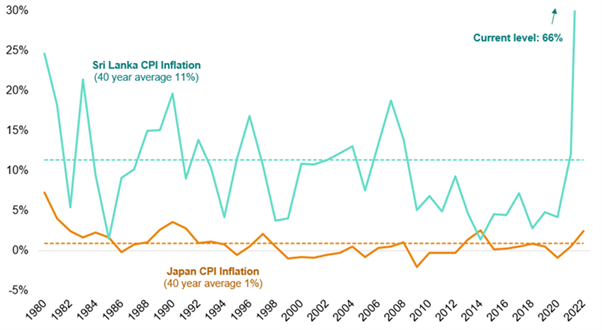
2022 has been dreadful for this. If you’re not reading about the war in Ukraine, it’s only because you’re watching the UK Conservative party have a full-scale public identity crisis, or the price of petrol slowly creeping towards £2 per litre, or are queueing at an airport, or worrying about another wave of COVID. Our investment approach in the face of such hysteria is to stay informed and engaged, while not getting overexcited about any single outcome. Arguably that has been even more difficult than usual in the first part of 2022.

I’ve got a few techniques which help me to take the long-term view – going for a long walk without my phone is top of the list or getting lost in a history book or science-fiction novel or watching the Test match. Living in the short-term is just too stressful, and genuinely reduces our ability to make the sensible long-term choices we need to make.

True long-term trends

It’s easy to miss the true long-term trends if we just focus on the short-term. A research company, GaveKal, had a great example of this a few years ago. They asked their readers what the most important event of 2007 was for financial markets.

Most of their readers are investors of some kind, so in one form or another, the answer was “the Global Financial Crisis”. That seems fair enough, that would have been my answer. We’re arguably still dealing with some of the fallout from this. Surely historians of the future will look back and pick that out as the key event of the year?

Perhaps not. Although it was 15 years ago, that is still a short-term way of thinking. Financial crises come around quite often (almost annually if you’re from Argentina or Venezuela). They leave their scars but tend not to change the world. No, the truly important event of 2007 was when Steve Jobs and Apple launched the iPhone, completely changing the way that we interact with the world around us.

Staying diversified and staying the course

Of course, in 2007, no one realised that the iPhone was as important as it has proved to be. Apple shares fell along with everything else, down 50% by 2009, along with the US market.

Since then however, the world has moved on from the financial crisis – the global equity market has quadrupled since its 2009 lows2. But Apple shares are up 56 times. Long-term trends always trump short-term crises.

The investment process of our chosen provider, EBI, is designed to capture these kinds of long-term trends via their strategic asset allocation.

Strategic Asset Allocation

EBI’s strategic asset allocation has two key benefits. First, it keeps our clients invested at all times. Over time, financial markets reflect long-term trends in the world; Apple moved from being less than 1% of the US equity market in 2009 to nearly 7% today. That’s why, more than anything else, staying invested in times of crisis is important, as it lets you capture these global trends. Having a plan for staying invested is essential.

Secondly, their strategic asset allocation keeps our clients diversified. It’s difficult to identify where and what the genuine long-term trends in the world are going to be. In 1989, the world was obsessed with the fall of the Berlin Wall, and the end of the Cold War. But in the mountains of Switzerland, Tim Berners-Lee had just created the World Wide Web. Which mattered more?

Sometimes even a century later, it’s tough to know what’s important: 1928 saw the discovery of penicillin and the launch of world’s first television station. I’m not sure I know which has been more important to the development of society. So, we need to make sure we’re invested in a little bit of everything, regardless of what seems most important at the time. A broadly diversified asset allocation keeps lots of fingers in lots of pies.

What will be the defining event of 2022 for financial markets?

It feels tempting to say Russia and Ukraine. But the truth is that may just be a geopolitical blip. What if it’s the shift to working from home of the way workers are paid, reducing inequality? Could it be the downfall of Facebook and Twitter? We just don’t know and may not know for years.

So, we rely on EBI’s robust investment process. Remaining invested, across lots of different sectors and regions, all of the time; it worked in 2008, and through Brexit, and COVID-19, and so far in 2022. We think it will keep on working for the next few decades too.

I do hope the above makes sense but, as always, if you have any concerns about your own financial arrangements or would like to discuss whether you are truly making the most of your money, please do not hesitate to call me.

With kind regards,

Yours sincerely

Graham Ponting CFP Chartered FCSI

Managing Partner


1 G. Lengauer, F. Esser, R. Berganza, Negativity in political news: A review of concepts, operationalizations and key findings. Journalism 13, 179–202 (2012)

2 Data from 01/03/2009 to 30/06/2022

Inflation, Interest Rates and Recession

This is my first ‘Round Robin’ e-mail since the end of June but that doesn’t mean I have not been paying attention to what has been going over the past couple of months – and it has been a lot!

The war in Ukraine continues unabated with seemingly no peaceful resolution in sight and this has exacerbated the inflationary pressures already being felt around the world. We knew of course that inflation was likely to rise as we emerged blinking into the sunlight at the end of the pandemic, people had money to burn and supply chains remained gummed up, with some countries, notably China, still enforcing lockdowns even now – the war in Ukraine has just made things worse.

The impact of the war in Ukraine cannot be overstated, the dramatic increase in wholesale gas prices is largely down to restricted supplies coming out of Russia and it’s difficult to see this changing much in the short-term, particularly while sanctions persist, and Putin needs a way to fight back.   

The outlook for the UK has worsened considerably over the past few months as the Bank of England (BOE) constantly revises its inflation forecasts upwards, heralding a tough winter ahead with energy bills likely become difficult for some and unaffordable for many. Whether or how the government can help those most in need remains to be seen.

The following chart shows how dramatically the BOE forecasts have changed since 2021:     

There are 2 particularly striking aspects to this chart,

  1. How did those in charge of forecasting inflation, the so called ‘experts’, get it so wrong?

  2. The expectation remains that inflation will revert to somewhere near the BOE’s target of 2.0% per annum by the end of 2024. Given my question in 1. above, how much confidence can we have that inflation will not prove more stubborn and difficult to shift?

In May 2021, the BOE was predicting inflation would peak at around 3.0%, by Feb 2022 this forecast had increased to 7.0%, only to be revised upwards again in May to 10.0% and then last week to 13.0%! As I say, how could they have got it so wrong?

It doesn’t help to apportion blame for this incompetence ….. but I’m going to. It’s Andrew Bailey’s fault, along with his fellow Monetary Policy Committee (MPC) members! Bailey was head of the Financial Conduct Authority from 2016 to the time of his appointment as Governor of The Bank of England, and he was pretty useless there too, presiding over a number of financial scandals in which many innocent victims lost their savings and dreams of a comfortable retirement. His reward for these failings was to be appointed to even higher office, a perfect example of someone being promoted beyond their capabilities, I do remember shaking my head at the time.

By way of providing a little balance, it must be said that being Governor of the BOE at the moment is something of a poison chalice, but we really should be able to expect more from our central bankers, steering us through this kind of maelstrom is pretty much their one and only job.

The markets take on this has been clear, the BOE should have raised rates sooner and more sharply as a signal that taming inflation was an urgent priority; it does now at least seem to have got the message. Last week’s Interest rate increase of 0.5% was the highest in 27 years, taking us to 1.75%.

The following chart shows how the Base Rate has changed since 2006.

The purpose of interest rate increases when attempting to combat inflation, is to reduce the amount of money in the economy, the idea is that if people and businesses have less money to spend (because their borrowing costs have gone up), demand will fall, followed soon after by prices. Whether this tactic will work, given that current inflation has not been caused by an overheating economy but (partly at least), by a foreign war, remains to be seen.

What interests me about the above chart is that there must be an entire generation of borrowers who have grown up on super cheap money and who might now face significant increases in their monthly mortgage and/or credit card payments at a time of rising energy bills and other non-discretionary items like food.

The last time interest rates went up by 0.5% rates were already higher, so the impact was arguably less. Going from 1.0% mortgage payments to 2.0% say, means your payments will double; if you are a young couple on a tight budget facing a winter of higher bills, this must be very concerning indeed.

At the BOE press conference, Andrew Bailey mentioned the dreaded ‘R’ word, recession and this prompted my eldest daughter to ask me, ‘What’s the difference between a recession and a depression?’ I think the following definition just about it sums it up:

I have already learned the difference between a Recession, a Depression and a Panic.

A Recession is where you tighten your belt; a Depression is when you haven’t any belt to tighten, and a Panic is when you have lost your pants.

— The Ephraim Enterprise (Ephraim, UT), 21 Jan. 1949

A depression is no laughing matter of course, just spend a few minutes reading about the early 1930s and you’ll see what I mean. By the way, I don’t think anyone is actually predicting a full-blown depression.

What did the financial markets make of all this talk of catastrophe? As usual, all the bad news, the increase in rates, the threat of recession etc. had already been priced in, and markets hardly moved at all. In fact, in recent days, US jobs data has surprised on the upside, putting a question mark over whether the US might actually escape a recession and markets have moved further forward. As I type this on 8th August, the FTSE is up 0.83% and the S&P 500 is up 0.74%, following quite a decent recovery which began on 16th June, see below:  

This chart shows the performance of a selection of the EBI portfolios since 16th June (yes, I did select the date carefully).

The portfolios are still down Year to Date, but things are looking a little better, for now.

This positive past few weeks does not necessarily mean the Bear Market is over and it’s entirely possible that markets might lurch downwards again at any moment BUT this shouldn’t alarm long-term investors.

Conclusion

In conclusion, the markets maybe don’t seem as pessimistic about prospects as Andrew Bailey did during his press conference but as always, we’ll have to wait and see.

I do hope the above makes sense but, as always, if you have any concerns about your own financial arrangements or would like to discuss whether you are truly making the most of your money, please do not hesitate to call me.

With kind regards,

Yours sincerely

Graham Ponting CFP Chartered MCSI

Managing Partner


“Why have my low-risk investments gone down?”

It is a good question and one I have been hearing a lot lately.

Traditionally it has been accepted that one of the best ways to protect oneself from steep equity market falls is to include high quality bonds in a diversified portfolio. Usually, we would expect to see higher concentrations of bonds lead to lower volatility when stock markets around the world encounter turbulence, so why isn’t that happening now?

In a typical market cycle, the economic conditions that might lead to an equity market correction, are often the same conditions that favour bonds. As an economy contracts for example, interest rates tend to fall to help businesses and consumers with the cost of borrowing, this reduction in interest rates makes the fixed income yield of a bond more attractive and, as result, prices of bonds go up while equity prices are falling.

In a 50/50 portfolio of equities and bonds, if the equity market falls by 10% and the bond market rises by say, 4, then the net loss is 6% and not the full 10% experienced by equities. In these circumstances the bond holding has done its job in mitigating the worst of the falls.

What we are seeing now however, is something of a perfect storm, even for the most highly diversified portfolios; currently there really is nowhere to hide.

The following is taken from some interim commentary by Evidence Based Investments (EBI) whose expertise we employ in constructing and managing our portfolios.

“Current Situation

The current situation is rare in that both equities and fixed income have been falling. High inflation and fears of a slowing growth rate have been headwinds to both asset classes and headaches to central banks.

Inflation concerns have rapidly increased in the first half of the year. While central banks thought inflation would partly normalise and take care of itself in 2022, they were blindsided by the sudden Russian invasion of Ukraine. Russia is also a major energy and commodity producer providing roughly 10% of the global supply of oil and supplying Europe with around a quarter of its crude oil imports and 40% of its natural gas imports. The sanctions put in place have therefore affected energy and commodity prices, pushing them exponentially to extreme levels. This has intensified the surge in inflation, supply chain disruption, and the risk to global growth. The biggest issue we are seeing is when certain industries can pass off inflationary pressures to the consumers: prime examples are the energy, automotive and retail industries.

Why are bond prices falling?

The main narrative is the shift in gears by the central banks on hawkish stances which has led to further downward pressure on bond prices. The market environment is rare in that bonds and equities are falling in the same direction due to inflationary pressures. The unfortunate events taking place in Ukraine have exacerbated inflationary pressures due to the unexpected inflation created.

For a bond, one of the risks incorporated into a bond’s price comes from interest rates. Since we are currently in a high inflationary environment or heading towards a period of higher inflation, the increased inflation will tend to be countered by an increase in interest rates to steer the economic growth rate to a sustainable level and soothe inflationary pressure. Bond prices have an inverse relationship to interest rates, therefore when the cost of borrowing money rises (when interest rates rise), bond prices usually fall, and vice-versa. The Bank of England has recently increased the base rate multiple times within a short period, with the market pricing in further increases expected throughout the year. EBI portfolios are well-positioned to weather this type of environment due to the effective duration of our bonds. Our average effective bond duration is short-dated (4.3 years compared to 7 years of the Bloomberg Global-Aggregate) and duration can be interpreted as the measure of the sensitivity of a bond’s price to changes in interest rates. Therefore, the bond portion of our portfolio has reduced risk stemming from interest rate rises compared to longer-duration bonds. Short-duration bonds are closer to maturity and have fewer coupon payments remaining, nevertheless, we are not immune to market events.

Conclusion

With the current economic climate, it’s easy to be sucked into flashfire reporting using a short-term lens. It’s important to remember the primary role of bonds in a well-diversified portfolio, the bond portion of the portfolio is there to offer stability against the increased volatility of equity markets over the long-term, and shorter-duration bonds inherently have less inflation and interest rate risk and provide better protection and a smoother path.”  

The following chart shows how EBI’s higher concentration of shorter-dated bonds has led to lower falls than the bond market as a whole, scant comfort though that may be during this difficult period.

As I have been explaining to several clients, at some point the economic weather will change and with it, investor sentiment. In the Sunday Times this week and in a couple of blogs I have been reading, there is already talk of the falls in both bonds and equities possibly being overdone and that the gloomy outlook has been more than priced into current valuations. As usual we will just have to wait and see.  

I do hope all of the above makes sense but, as always, if you have any concerns about your own financial arrangements or would like to discuss whether you are truly making the most of your money, please do not hesitate to call me.

With kind regards,

Yours sincerely

Graham Ponting CFP Chartered MCSI

Managing Partner